
Ishikawa
17 jun 2022
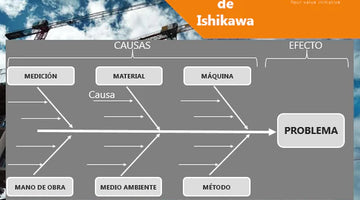
THE ISHIKAWA DIAGRAM OR CAUSE-EFFECT DIAGRAM ADDS VALUE AND IMPROVES COMPANY PROCESSES.
The Ishikawa Diagram or Cause-Effect Diagram (also known as Fishbone Diagram due to its structure) consists of a graphic representation that allows visualizing the causes that explain a certain problem, which makes it a tool of the Management of the Quality widely used since it guides decision making by addressing the bases that determine poor performance...