steps
- Todas
- 5 porqués
- 5 whys
- A3
- Agilidad
- Agility
- Almacenamiento
- ambiental
- analisis
- aplicación
- aprender
- aprendizajes
- Article
- Artículo
- BIM
- blog
- calidad
- calidad total
- cambios
- Canvas
- certificación
- Chile
- ciclo
- Clase
- cliente
- Clientes
- Coffee
- Compañias
- Companies
- comunicación
- conocimientos
- Construcción
- Construction
- construir
- convicción
- Coronavirus
- COVID
- COVID-19
- Cultura
- Culture
- curso
- Curso Lean
- Cursos
- definir indicadores
- Demanda
- deming
- Descuentos
- design
- desperdicio
- Diagram
- Digital
- digital transformation
- E-Commerce
- Educación
- effect
- emprendedores
- emprender
- empresa
- Empresas
- English
- Entrada
- Entrenamientos
- Equipos
- eric ries
- Estandar
- estrategia
- evolución
- Experience
- Expertos
- factory
- feliz navidad
- filosofía lean
- Flexibilidad
- flujo
- Formación
- Formato A3
- Future
- futuro
- Gemba
- Gemba Walk
- Gestión
- Grafic
- Guiding
- herramientas
- Herramientas Lean
- identificar
- impacto
- implementación
- Implementation
- indicadores
- indicadores clave
- industria
- industrias
- Industry
- Information
- Innovación
- Innovation
- Inscripción
- Insutrias
- Invitación
- Ishikawa
- Kaizen
- kanban
- Key Performance Indicator
- KPI
- Last Planner® System
- Lean
- LEAN BIM
- lean bim transformation
- lean construction
- lean culture
- Lean Management
- lean manager
- Lean Mangement
- lean manufacture
- lean manufacturing
- Lean Production
- lean transformation
- leanbim
- leanconstruction
- leanculture
- LeanInn
- leanmanagement
- leanmanufacturing
- Leanmanufaturing
- leanprocess
- Learning
- LPS
- Management
- Mantenimiento
- manufacturing
- maximizar
- medición
- medir
- mejora
- Mejora Continua
- Methodologies
- Metodología
- minera
- minería
- Mining
- mvp
- Negocios
- Networking
- Noticias
- Objectives
- Objetivos
- Operaciones
- optimizacion
- optimizar
- Organización
- Organizaciones
- Organization
- Outbreak
- Pareto
- Planificación
- planificación colaborativa
- Planification
- poka yoke
- preventa
- Procesos
- process
- Processes
- productividad
- producto
- Productos
- Profesional
- Programa
- Project
- Projects
- proveedores
- Proyectos
- Pull
- Push
- PYMES
- Quality
- Recursos Humanos
- Resiliencia
- Resultados
- Results
- seguridad
- Servicios
- Shingo
- Sin categoría
- SIPOC
- Sistemas
- SMED
- standard work
- startup
- steps
- Stock
- Systems
- Tableros
- Talento
- Team
- Team Work
- Techniques
- tecnología
- Tools
- TPM
- Trabajo Estandar
- trabajoestándar
- Training
- valor
- Value
- Value Stream Mapping
- Values
- Virtual
- Visita
- VSM
- Walk
17 jun 2022
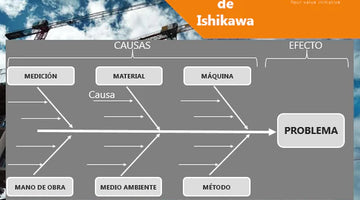
THE ISHIKAWA DIAGRAM OR CAUSE-EFFECT DIAGRAM ADDS VALUE AND IMPROVES COMPANY PROCESSES.
The Ishikawa Diagram or Cause-Effect Diagram (also known as Fishbone Diagram due to its structure) consists of a graphic representation that allows visualizing the causes that explain a certain problem, which makes it a tool of the Management of the Quality widely used since it guides decision making by addressing the bases that determine poor performance...